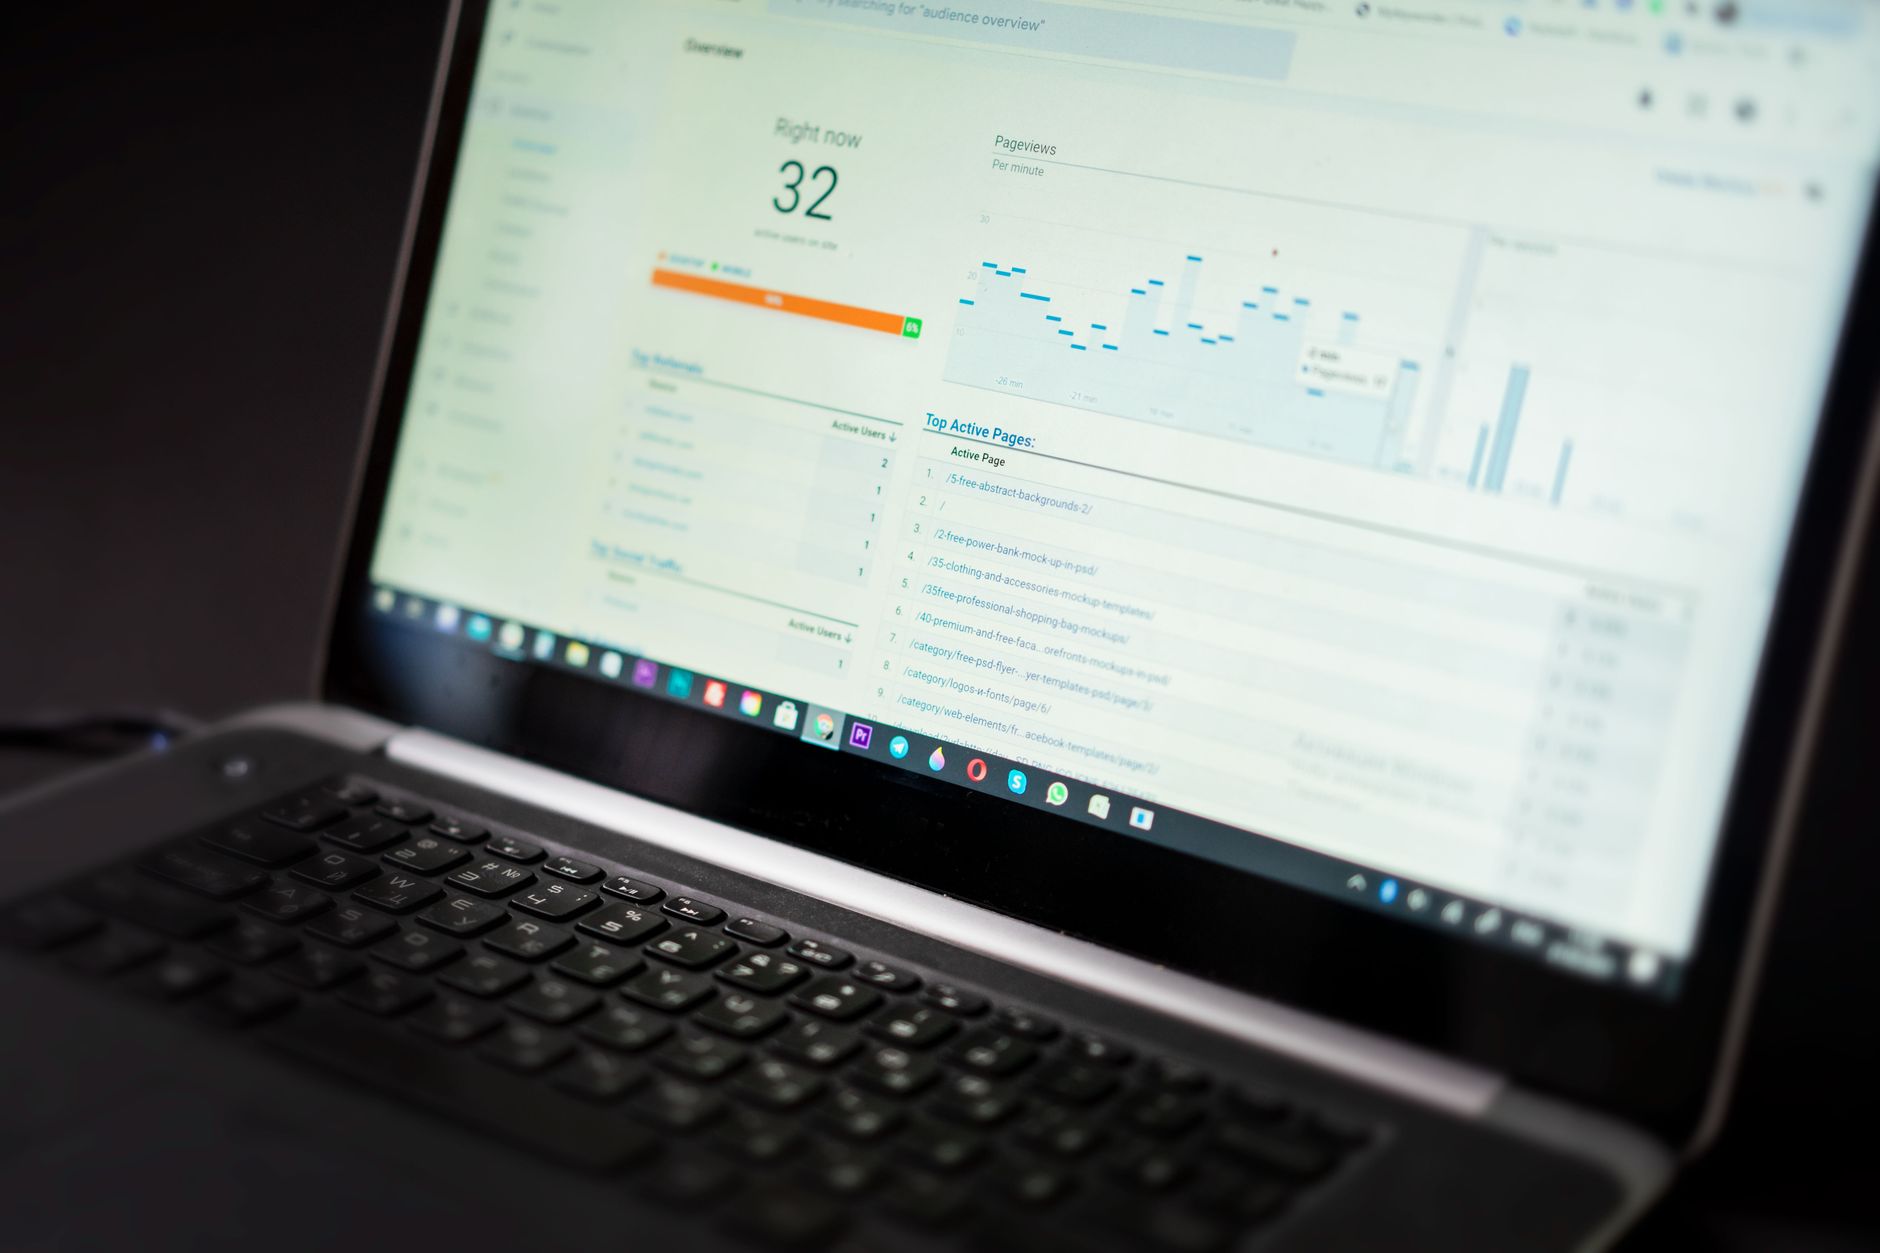

Navigating the Google Search Console performance report can feel like looking at a massive spreadsheet of raw data without a clear map. Yet, this single tool holds the key to understanding how your target audience actually discovers your website in organic search. Far beyond simple vanity metrics, mastering this report allows you to pinpoint declining traffic trends, identify untapped keyword opportunities, and measure the real-world impact of your on-page SEO improvements over time.
Whether you manage a growing e-commerce catalog or a niche authority blog, interpreting these search analytics correctly transforms guesswork into a repeatable growth strategy. In this comprehensive guide, we will break down how to dissect your metrics, uncover hidden performance insights, and translate your findings into actionable search optimization steps.
Understanding the Core Metrics in the Performance Report
Before diving into advanced analysis, you must clearly understand what each of the four primary metrics actually measures. Misinterpreting these figures often leads to misguided SEO adjustments that waste valuable time.
Clicks, Impressions, CTR, and Average Position
Google provides four foundational data points at the top of your performance dashboard:
- Clicks: The total number of organic user visits from Google search results to your website.
- Impressions: How many times a link to your website appeared in user search results.
- CTR (Click-Through Rate): The percentage of impressions that resulted in a click (Clicks divided by Impressions).
- Average Position: The typical ranking of your site’s URLs for a specific query or set of queries.
It is important to remember that average position can sometimes be misleading. For instance, if you rank #1 for a heavily branded term and #20 for multiple competitive head terms, your average position might hover around #10, masking your actual performance distribution.
How to Analyze Keyword Data and Search Queries
The Queries tab is where your deepest SEO insights live. By default, Search Console shows you the top terms driving traffic, but surface-level observation rarely tells the whole story.
Finding Quick-Win Optimization Opportunities
One of the most effective tactics for quick traffic growth is identifying keywords ranking on the second page of Google (positions 11 through 20) that already receive a decent number of impressions. These queries indicate that search engines already trust your content to some degree, but your page lacks the depth or relevance to push into the top ten.
Filter your performance report to show queries with an average position between 10 and 20. Review the associated URLs and look for opportunities to:
- Expand your existing content to answer related user questions more thoroughly.
- Improve your title tags and meta descriptions to boost click-through rates.
- Add internal links from other high-authority pages on your domain.
Performance Report Comparison Table
Different analytical approaches require different metric combinations. Use this quick reference guide to determine which data signals to focus on based on your immediate SEO objectives.
| Optimization Goal | Primary Metric Focus | What to Look For |
|---|---|---|
| CTR Improvement | High Impressions, Low CTR | Pages ranking well (positions 1-5) but suffering from unappealing titles or descriptions. |
| Content Expansion | Low Position (11-20), High Impressions | Queries close to page one that need enhanced content depth and semantic optimization. |
| Traffic Defense | Declining Clicks over Time | Pages experiencing a drop in average position or sudden loss of impression share. |
Filtering and Segmenting Your Data Effectively
Looking at your entire domain’s performance at once rarely yields actionable insights. To uncover true patterns, you must leverage Google Search Console’s robust filtering capabilities.
Using Dimensions to Isolate Traffic Sources
By utilizing the top-level filter controls, you can slice your data across several vital dimensions:
- Pages: Analyze which specific URLs are losing or gaining traffic.
- Countries: Identify international traffic patterns if your target audience spans multiple geographic regions.
- Devices: Compare mobile versus desktop search performance to spot usability or technical roadblocks.
- Search Appearance: Track how your structured data, FAQ snippets, or video results perform in SERPs.
Conseils d'experts
Erreurs courantes à éviter
Foire aux questions
How far back does historical data go in the performance report?
Google Search Console retains and displays up to 16 months of historical performance data. This extended timeframe allows you to analyze year-over-year search trends, seasonal traffic shifts, and long-term algorithmic impacts on your organic visibility.
Why do clicks in Search Console not match my Google Analytics traffic?
Discrepancies between Search Console clicks and Google Analytics sessions are completely normal. Search Console measures raw clicks from search result pages, whereas analytics tools measure sessions, which require tracking codes to load successfully and account for users who bounce before the script executes.
Can I filter performance data by specific regex patterns?
Yes. By clicking the query filter and selecting ‘Custom (regex)’, you can build advanced regular expression filters to analyze specific groups of keywords, brand variations, or long-tail phrasing patterns across your entire search footprint.
How often is the performance report data updated?
Performance data in Google Search Console is typically refreshed every 24 to 48 hours, though data from the most recent few hours is usually withheld while Google processes and validates query logs for spam and accuracy.
What does a high impression count with zero clicks mean?
A high impression count paired with zero clicks usually indicates that your website is appearing in search results for queries where your content does not match the user’s intent, or your title tag and meta description fail to compel users to click your link.
Is it possible to download all Search Console performance data?
Yes, you can export your performance report data directly into Google Sheets, Excel, or download it as a CSV file. For larger websites exceeding the manual row limits, you can also access this data programmatically using the Google Search Console API.
How do regex filters help in SEO audits?
Regex filters allow you to group related search queries together using pattern matching. For example, you can use regex to isolate all questions containing ‘how to’, ‘what is’, or specific product variations to evaluate informational search intent performance at scale.
Why does my average position fluctuate daily?
Daily position fluctuations are a standard part of organic search. Google constantly tests different ranking orders, evaluates user engagement signals, and updates index weights, causing minor daily shifts in your average positioning for competitive search terms.
Conclusion
Mastering the Google Search Console performance report is an essential skill for anyone serious about growing their organic search visibility. By moving past surface-level metrics and actively leveraging filters, comparison dates, and query analysis, you can uncover clear pathways for traffic growth. Start applying these analytical strategies to your own reports today, and turn raw data into a reliable roadmap for sustained SEO success.